Climate change and the greenhouse-gas emissions causing it are complicated international issues. But when we focus solely on the United States, it can actually be easy to downplay the true extent of the crisis.
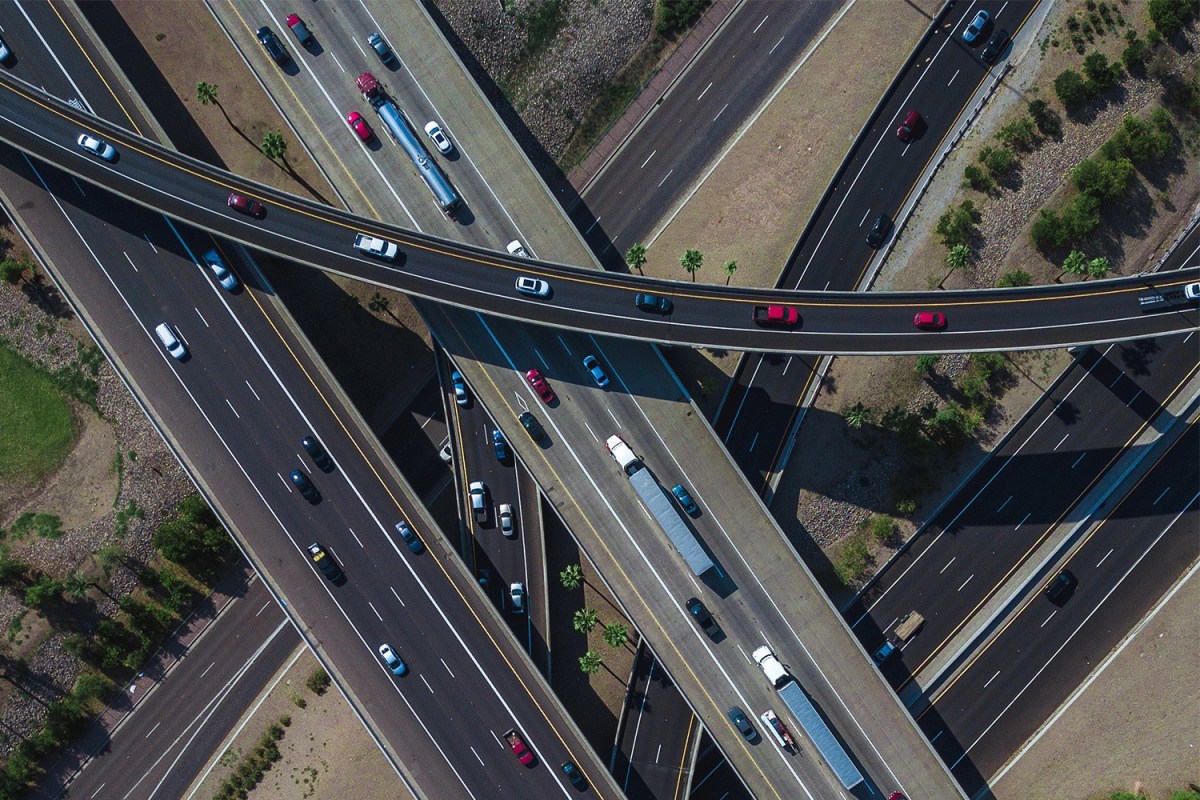
In terms of the cars we drive, a reasonable person would look at the advances made in automotive technology (from hybrid powertrains to fully electric vehicles) and fuel consumption, maybe even throw the rise of ride-sharing and environmental awareness in there, and come to the conclusion that we must be polluting less. (Just look at all the Priuses on the road!) But according to new data released in September from Boston University’s Database of Road Transportation Emissions, that’s wrong; between 1990 and 2017, emissions have gone way up.
One reason for this increase seems to be obvious: there are way more people! According to the U.S. Census Bureau, there were roughly 249 million people living here in 1990, compared with 330 million living here today. That’s a lot of Ford F-150s and Toyota Camrys spitting out CO2. But that’s not even close to the whole story.
On Thursday, The New York Times released an enlightening if disconcerting interactive feature created from this data set. The most interesting part is that readers can highlight the metro area they live in and see how much auto emissions have changed in total versus how much they have changed per person (an obviously necessary variable due to changing populations). Think you live in a “green” city? You might be in for a rude awakening.
But instead of simply clicking on your metro area (or the closest one to you) and calling it quits, here are five takeaways about auto emissions in America that you probably didn’t know:
- Automotive emissions were declining. Now they’re back.
The most concerning piece of the Times feature isn’t the map of the U.S. or graph of emissions by city. It’s the small graph showing transportation emissions between 1990 and 2017, and how we at one point were in significant decline. The Times ties that decrease to the recession, and the resurgence to three things: a strong economy (we’re buying bigger vehicles and more gas), low gas prices (we’re driving more) and an increase in freight trucking. - There could be a sharper increase relatively soon.
Part of the reason the economic rebound under the Obama administration didn’t lead to sudden increases in auto emissions is due to the fuel economy standards put in place. The Trump administration’s insistence on not only rolling back national standards, but stopping states like California from setting their own, could lead to a continued increase. - New York looks bad, but it’s Dallas we should worry about.
Without even looking at total emissions, you can probably guess the worst offenders: New York City and Los Angeles. But that statistic is misleading. Per person, NYC is one of the lowest contributors of greenhouse gases; cities like Dallas that rely on cars but offer subpar public transportation options are much worse. - Worried about emissions in urban areas? Blame suburbs.
The focus on metro areas may also lead you to believe that people who live in cities are the problem. Not necessarily. A significant portion of the increase can be traced to suburban residents commuting, as well as simply driving in their communities (look to the darker lines on the map). - This won’t be solved by driving less, but that’s a start.
The narrative around fossil-fuel emissions and climate change is thankfully changing to put the onus on the companies responsible rather than the individual. But when it comes to car emissions, part of the solution does come down to regular drivers. We know we’re collectively driving more, so we should figure out ways to cut back. Automakers are influenced by consumer habits, so we should be buying more fuel-efficient vehicles. Those things alone won’t stop the worrying increase, but they’re part of a larger whole that could help turn that graph back around.
This article appeared in an InsideHook newsletter. Sign up for free to get more on travel, wellness, style, drinking, and culture.


