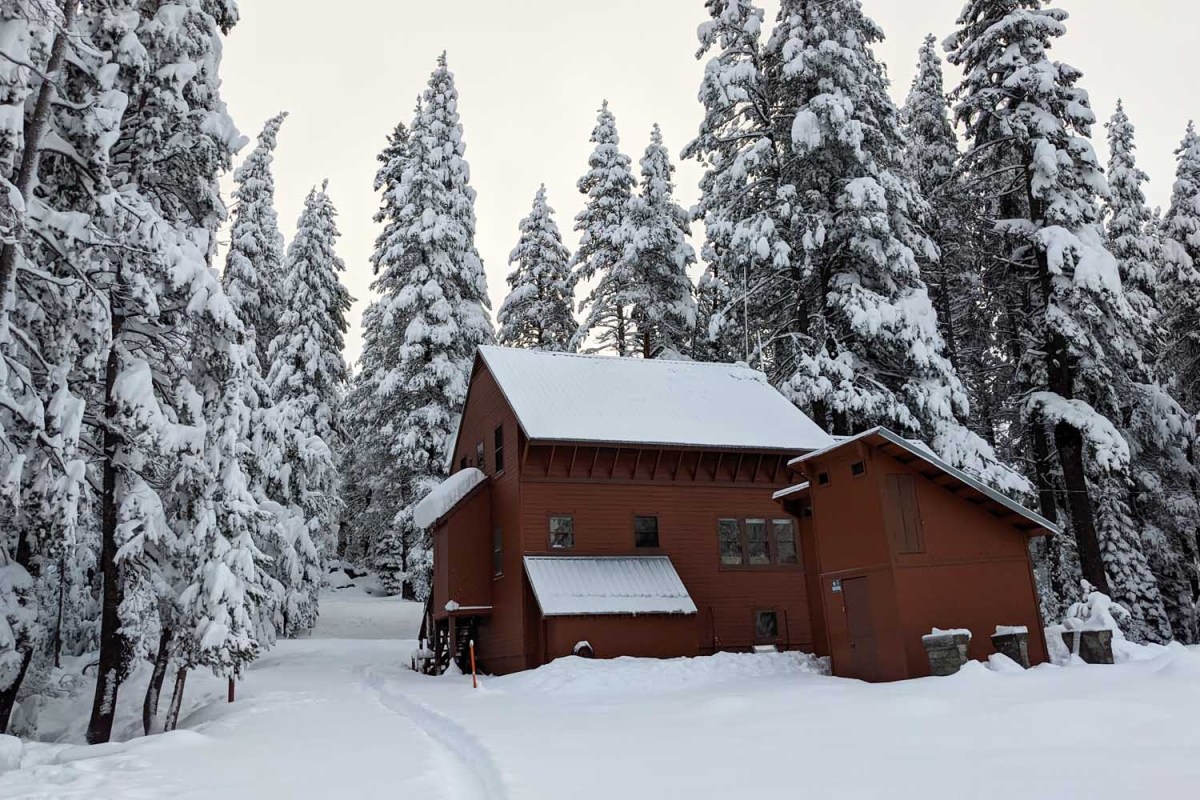
One of the great charms of the holidays this year — at least for everyone whose GPS hadn’t routed them along summer-only dirt roads through the mountains — was the gleeful snow reports from the Sierra. Over two feet of snow fell on Christmas Eve alone; December 2021 would enter the record books as the third-snowiest month at the UC Berkeley Central Sierra Snow Lab, high up on Donner Pass, where snowfall measurements have been taken since 1879.
Currently manning the record books (and the hugely relevant Twitter) was Dr. Andrew Schwartz (@snow_d0c), an atmospheric scientist specializing in snow. Schwartz only joined the lab in April and begins each work day at 8 a.m. by measuring the snow, “whether that be a new snowfall or snow on the ground.” Here, we speak to him about what actually happens at the Lab, what this winter’s snowfall means for next autumn’s wildfires, and the million-dollar forecasting question: How much more snow will we get before the end of the season?
InsideHook: So what sort of science is actually happening at the Snow Lab?
Dr. Andrew Schwartz: The most valuable research we’ve been doing is taking measurements of snowfall precipitation — rain and snow — and also snowpack for the past 75 years. And then prior to that, there are records up here on the summit of snow going back to 1879, when the railroad first started doing this. We’re actively involved in continuing one of the longest measurement records of snow in the entire world.
We’re also looking at things like atmospheric rivers, and we’re taking more of an active role going into the future on what we call compounding events. It might be that you’re in a drought — as we are — and you have a big forest fire come through and alter the landscape. How much snow or water are you actually going to get out of that landscape? We look at the severity impacts from climate change, wildfires, rain-on-snow events and stronger-than-past atmospheric rivers.
Have you observed anything particularly interesting or unexpected?
The most interesting thing is the broad-scale variability conditions that we get from month to month. For example, in Colorado, where I was born and raised, once it starts to snow, the mountains generally keep their snowpack, and it keeps snowing through the majority of the winter. Whereas here, we had this big, four-foot October snow — the second-snowiest October on record — but then it melted off completely, leaving bare ground by November. We had another record-breaking month in December, and then we’re seeing the same trend now in January, when there’s been basically no snowfall. It’s what I call “weather whiplash”: one month, it’s crazy snow, the next month, it’s nothing.
Is that a product of a changing climate or is that how it’s always been?
A little bit of both, realistically. We have natural variability in the atmosphere — no two years will be alike, no two storms. But climate change is definitely enhancing that variability, from month to month and year to year.
Are there any facts or information you have shared with the public that’s changed people’s minds or pushed them into a new way of thinking about climate change?
At the end of the day, it really just comes down to presenting the facts and then hoping that we can make the world better by presenting those facts. If we present the trends that are occurring here at the Lab, they go through peer review, and then they’re published, water managers might pick them up to better manage the water in California. That’s ultimately the goal that we have.
Is it naive to connect the giant snowstorms this winter with the possibility of a less-intense wildfire season this coming year?
Having a record-breaking December like that is terrific — it does help us out with our drought conditions. However, at this point in time, we have only received about 70 to 75 percent of what we would hope for total snowfall over an entire year. The problem comes if we don’t get more snow. We’ve had a dry January, and we might still have a dry February, March and April — so we still might wind up with 75 percent of the water in our snowpack that we would want. And then we’re contributing to the drought more than helping it.
I’ve been using the term “guarded optimism.” Keep up with pulling back on your water use. Try to keep in mind that we are stil in drought — but assuming that we have at least one or two upcoming months with average snowfall or above-average snowfall, it could end up being a really good year for us. It’s too early to tell.
One of the things that we need to be cautious about is that in terms of snowpack directly influencing our fire behavior — both with severity and the overall extent of them — it really comes down to how long that snowpack is on. If we get above-average snowpack, but we have really, really high temperatures in May, it melts, and we may wind up with similar fire conditions to what we had last year. If we end up with an above-average snowpack, but it’s cooler and that snowpack lasts until June, July or August, then it will really help us out.
So there is definitely that connection there, but it’s not necessarily — as we say in science — a one-to-one correlation. There have to be other factors.
What have you been interested in as you review the nearly 150 years’ worth of records?
How much we can swing from year to year. In 1962, we had about 67½ total feet of snowfall. In 1977, we only had 15 feet — that’s a difference of about 50 feet overall, which is pretty incredible. Come 2015, we had even less — only got 10 feet. There’s so much variability year to year.
For this point in time, there’s nothing really out of the ordinary that we’ve noticed for this snowpack. Some of the work the previous manager did showed a small decline in the amount of snow that’s happening due to climate change, and we are seeing a bit of an increase in overall precipitation but decreases in snow, which means we’re seeing more rain here on the summit.
That extreme variability — how unique is that?
I’ve worked in other locations, where there’s less variability — we might see a couple of winters with 10 feet or 15 feet, or then maybe eight feet. So there’s less of a swing between a big winter and a small winter. Here, we’ll get these consecutive, strong atmospheric rivers, and it’ll just dump feet and feet and feet of snow on us for weeks — which leads to these really big winters.
How do you think this season will end up?
That’s the golden question right now. I have a background in meteorology and atmospheric science, so I do forecast. At this current point in time, it’s not looking like we’ll get that much precipitation in the next one to two weeks. There are some models hinting that the high pressure system off the coast might move a little bit and allow us to get precipitation at the beginning of February, but that’s far from a sure thing. Current seasonal trends look like we’re going to be a little bit drier than average based on what NOAA has put out. Unfortunately, there aren’t any trends that develop here in the Central Sierra during La Niña years, which is what we’re currently in. Some areas will have above-average snowfall, some areas will have below-average snowfall — here in the Central Sierra, we can go either way. We don’t have the best long-term outlook currently because it could be one or the other.
Meet your guide
More Like This


This article was featured in the InsideHook SF newsletter. Sign up now for more from the Bay Area.