Your favorite TV series was never perfect. And now there are two charts that’ll help you figure when your beloved shows go downhill.
Inspired by a “Simpsons Heatmap” graphic posted on Reddit over two years ago, software engineer and data analyst Jim Vallandingham recently built the site SeriesHeat. It allows you to search for your favorite show and get an average IMDb rating for any episode.
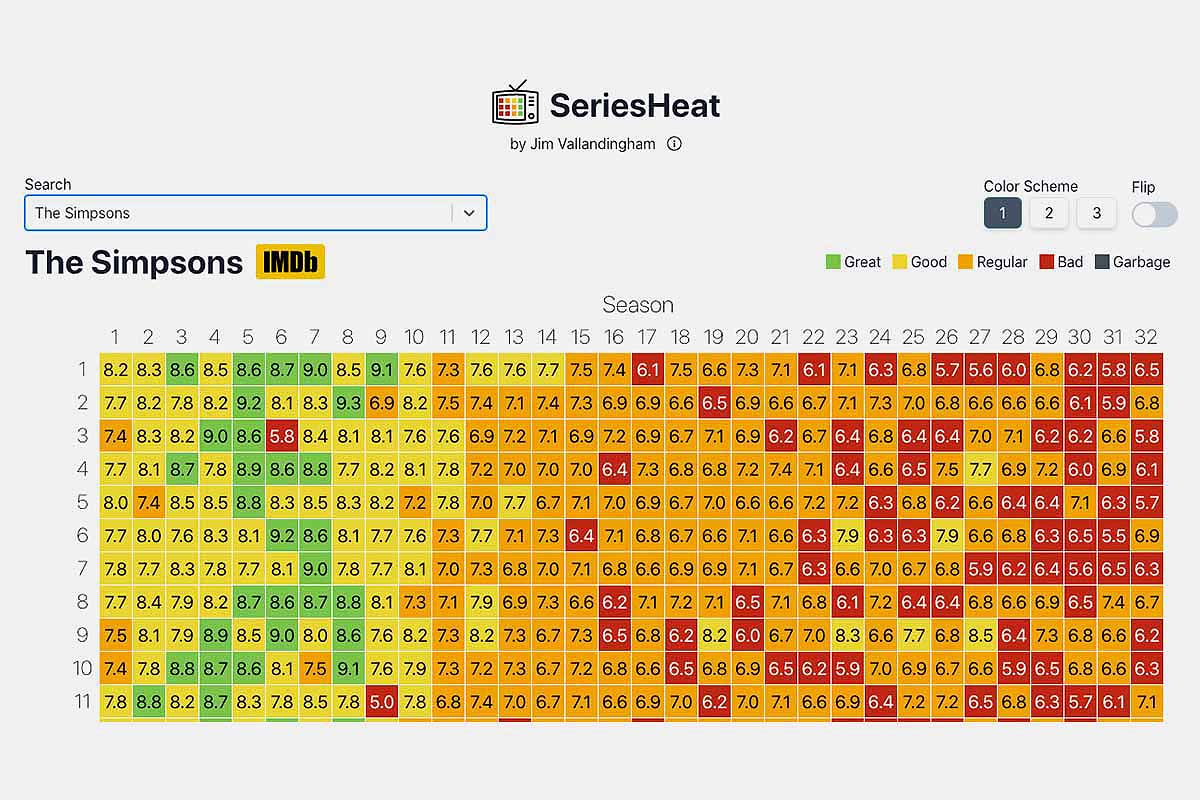
The data itself is curated from IMDb Datasets, which is information provided by the movie site, but not presented in an easy-to-understand way; hence, the need for people like Vallandingham and also Nathan Yau, who turned the average episode rating of the longest-running shows into a different type of graph that uses colors to chart the quality of a series through multiple years.
There are an estimated 164,000 series on IMDb, but obviously, most people want to know about the same dozen or so shows that seemingly fluctuate wildly in quality (the extremely minimalist SeriesHeat site helpfully suggests The Simpsons, Futurama, Doctor Who and Game of Thrones).
So, when did some of these popular shows go downhill?
- The Simpsons: It’s been covered before, but the last “great” episode (8.6 or above out of 10) of this long-running animated series happened in season 12. And season 11 seemed to be the first that found most episodes rated as middling (or “regular”) with season 30 getting a particular amount of dislike.
- Game of Thrones: Surprising no one, every season pretty much had all “great” episodes … except the last one, where half the episodes were rated “bad” or “garbage.”
- Doctor Who: In a rather depressing analysis, it looks like the second Jodie Whittaker became the first female Doctor (in 2018) is when the viewer reviews tanked (I don’t watch the series, but fans suggest a change in head writer and producers may have also played a role).
- The Daily Show: Because Comedy Central’s comedy-news series has been on so long (nearing 4,000 episodes), the chart for the show is a bit ridiculous and hard to read. That said, the Jon Stewart era certainly has more love than either Trevor Noah or Craig Kilborn, although some of the episodes only have a dozen or so votes.
Since “jumping the shark” has become the go-to idiom for the moment when a TV show starts to decline in quality, usually through an ill-conceived plot line or casting choice, you might be curious how the show that inspired that phrase (Happy Days) scored over its duration. Oddly, its literal jumping-the-shark episode (season 5, episode 3) scored an “average” rating with IMDb viewers and the show itself didn’t see a noticeable dip in appreciation until three years later.
More Like This


Thanks for reading InsideHook. Sign up for our daily newsletter and be in the know.